Veterans United in
Charlotte-Concord-Gastonia, NC
in the NC, SC metro area
The Charlotte housing market in March has weakened compared to last year with the median home price around $415,000 — down 1.2% from last year. Homes for sale in Charlotte* now spend an average of 78 days on the market, and nearly 29% sell below asking price, giving buyers more negotiating power.
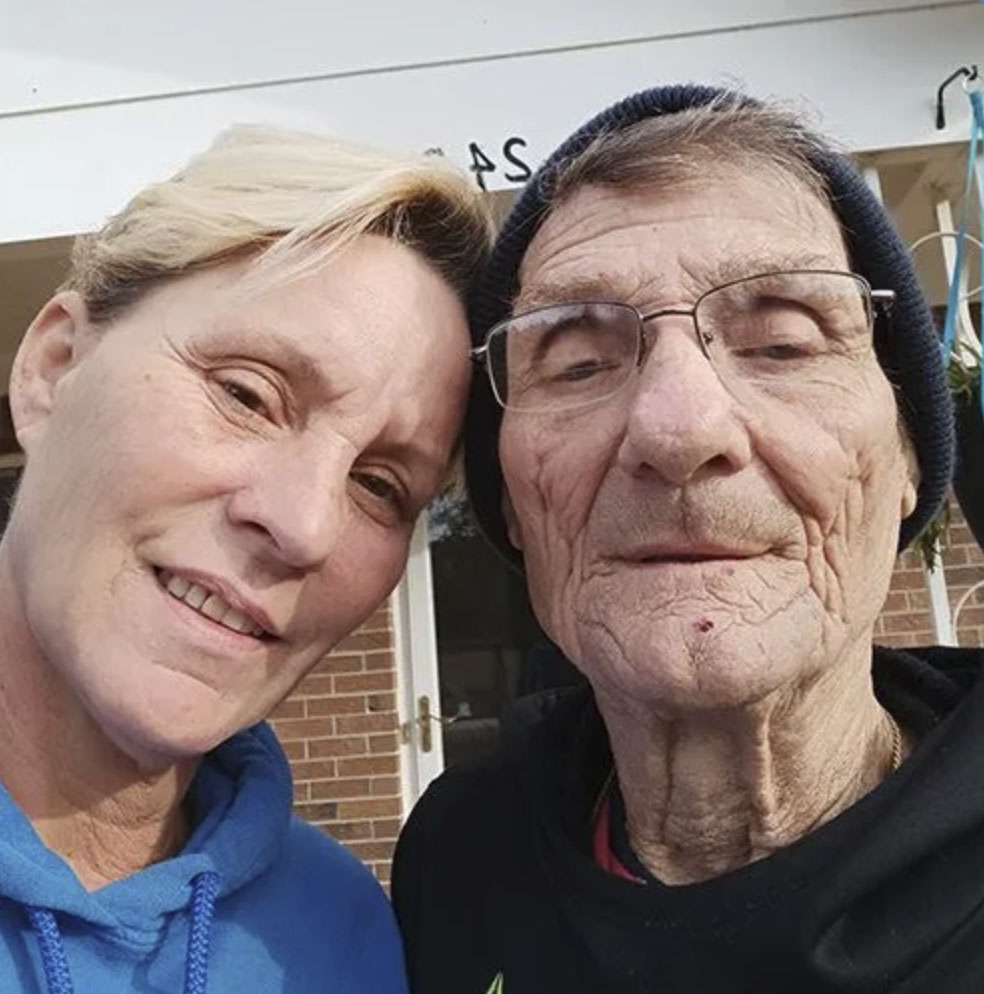
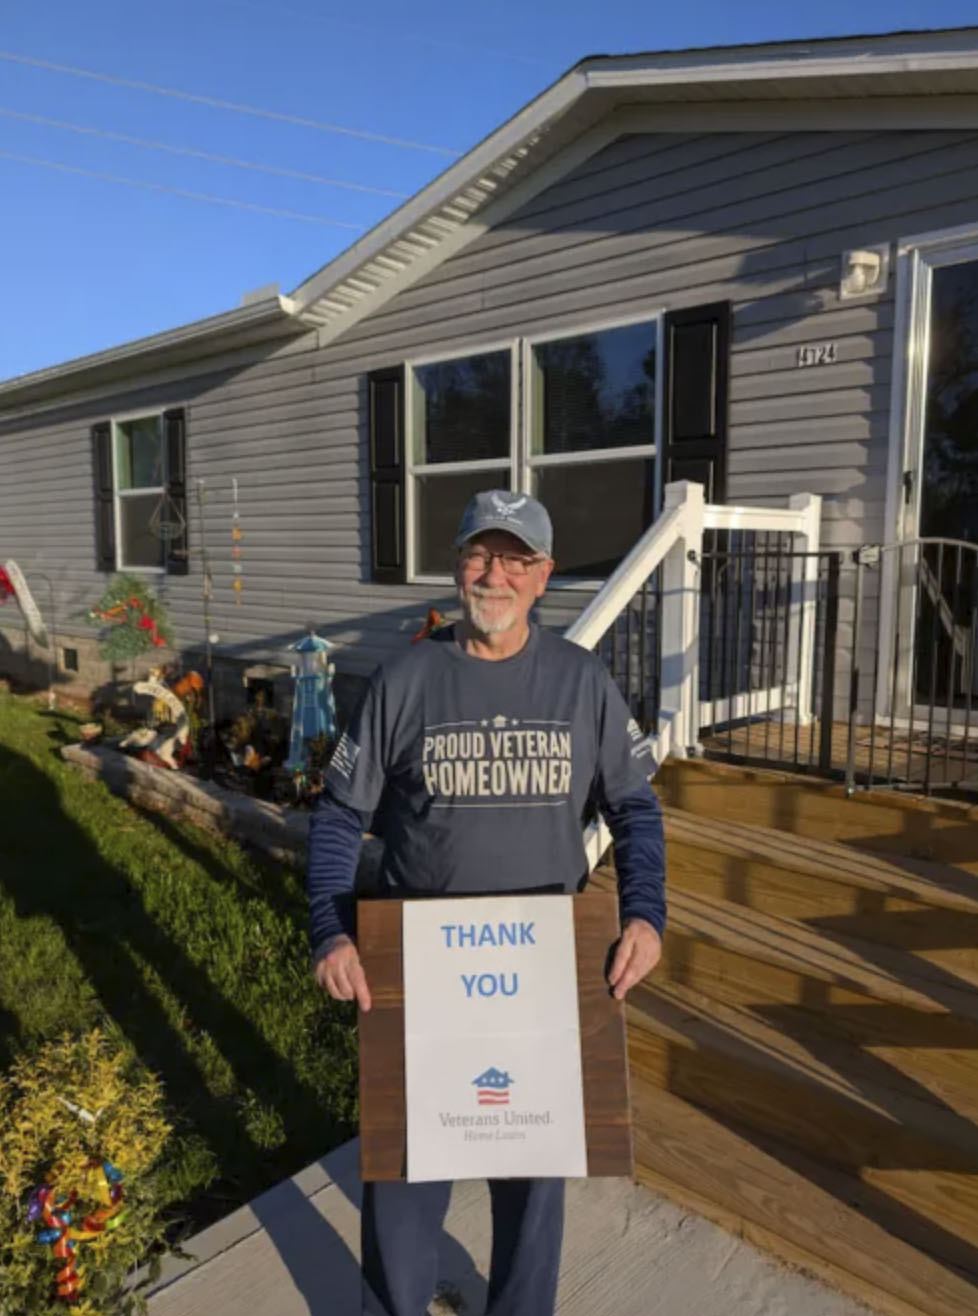
Just a few of the 780,895 Veterans we've helped get into homes.
4,584 Veterans in the Charlotte-Concord-Gastonia, NC-SC area alone!
Based on Veterans United and Veterans United Realty's internal data.
Andrew K. | U.S. Army
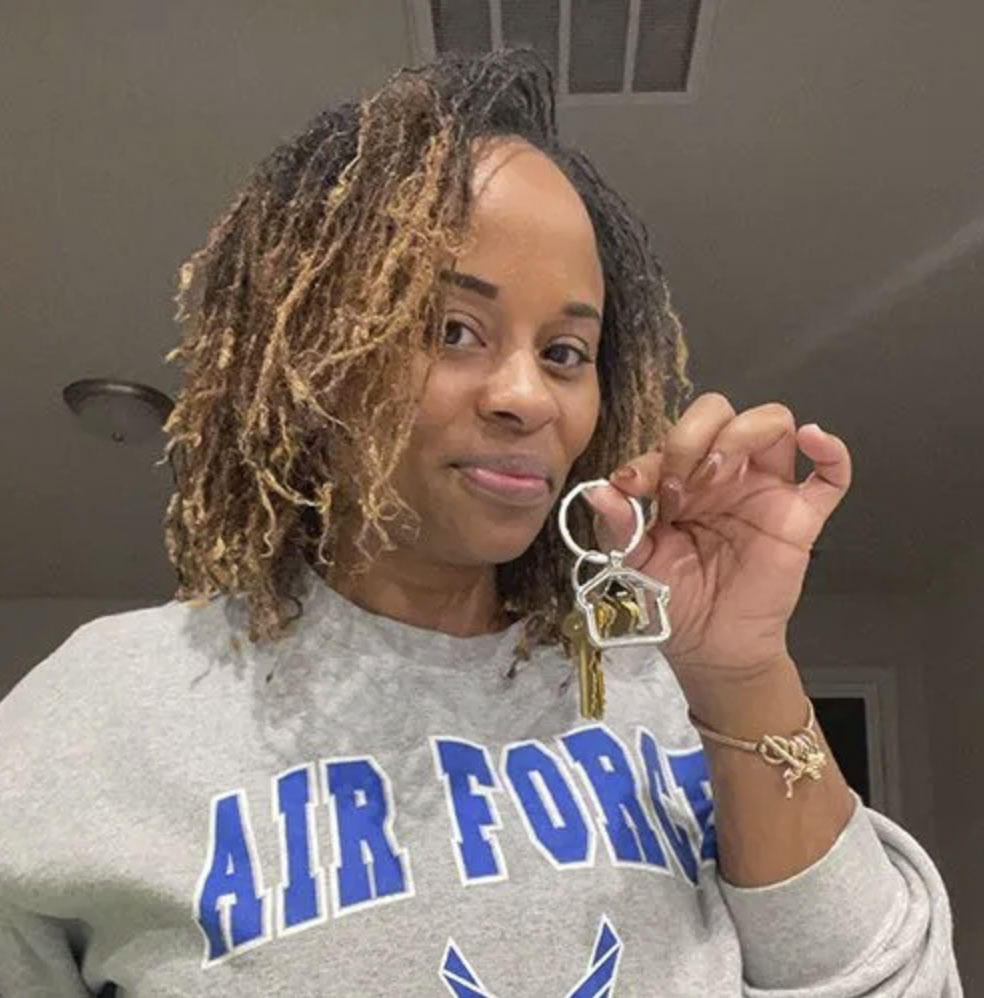
Crystal J. | U.S. Air Force
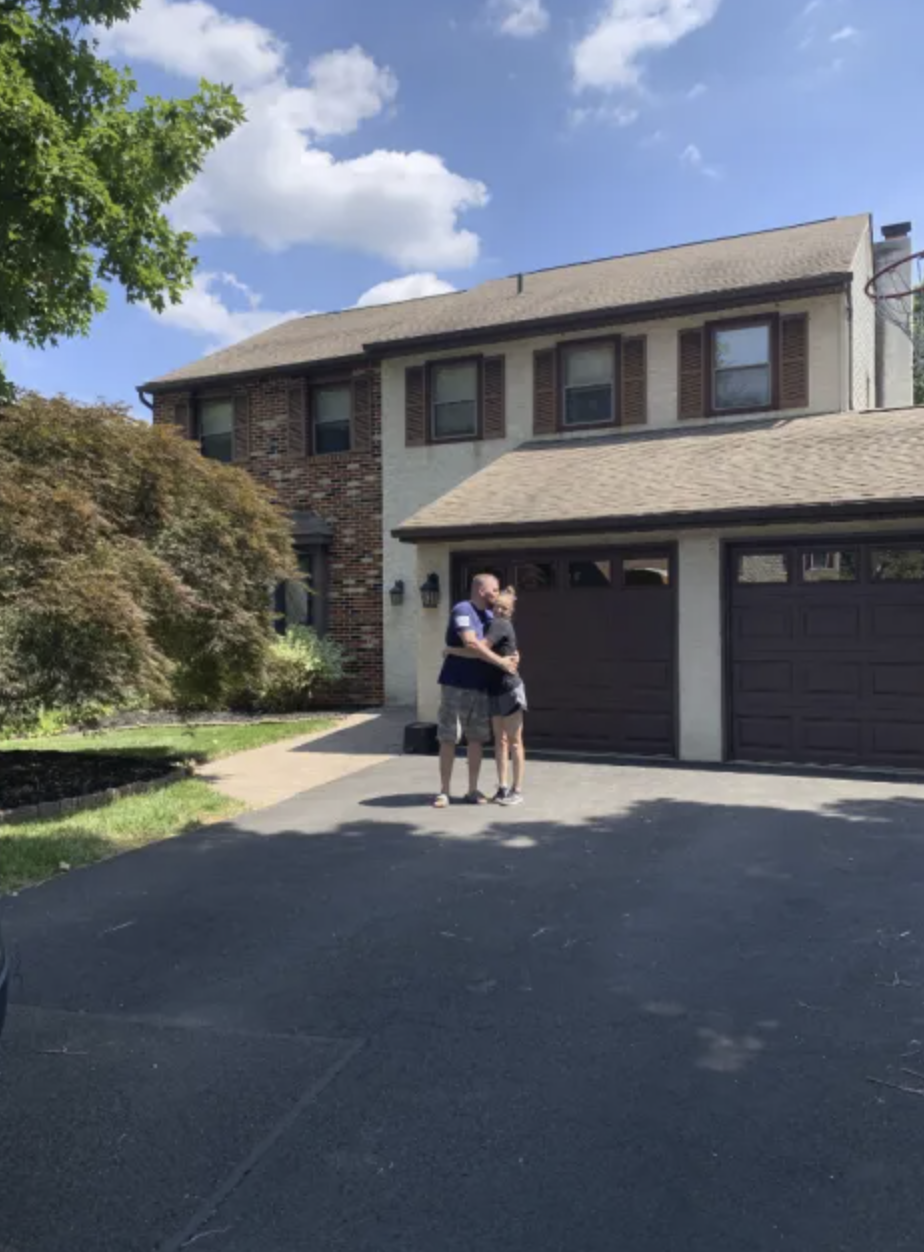
David P. | U.S. Marine Corps
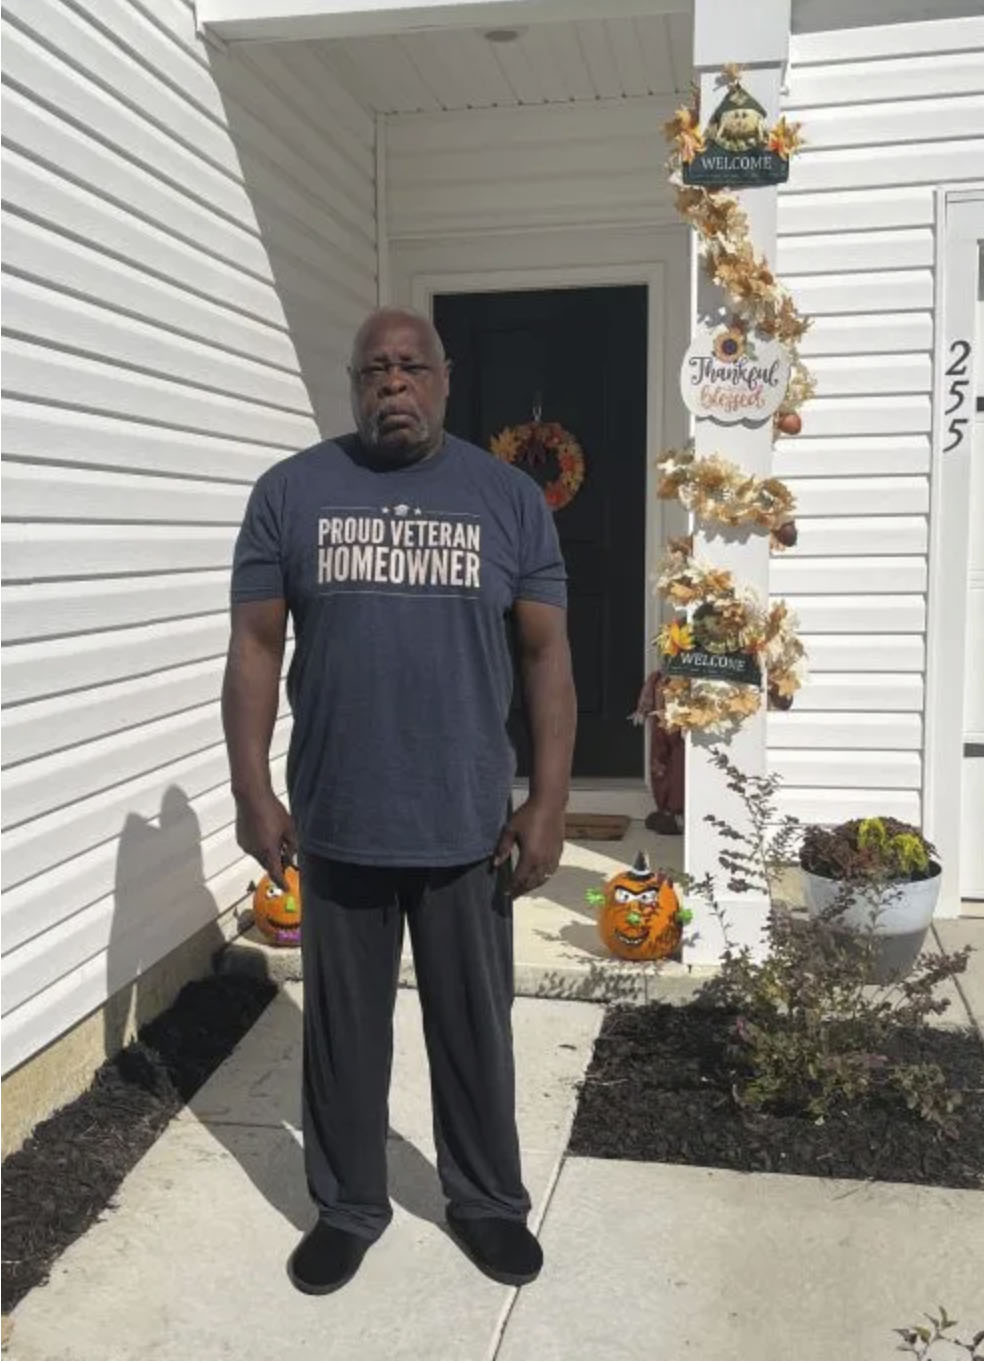
Lester B. | U.S. Army
Gregory L. | U.S. Military
Jason S. | U.S. Army
Terry M. | U.S. Air Force
Charlotte Metro Housing Market in February 2026
Median Days on Market
78 days
Homes are staying on the market 8.33% longer than last month.
Average Listing Price
$576,598
Average home prices are down 1.53% since last month.
Active Listings
8,202 homes
Number of houses on the market are down 6.37% since last month.
Homes in the Charlotte region sell at a moderate pace.
29% of listings reduced price last month.
3,464
New listings
Up 54% from last month
8,202
Active listings
Down 6.4% from last month
VA Loan Market Share
8% of originations last year were VA loans.
4,595
Sold last year
1/12
Were VA loans
Charlotte Area
Own vs Rent Trends
A higher share of owner-occupied homes often reflects stronger long-term ties to the community, since homeowners are more likely to stay in one place and invest in their neighborhoods. By contrast, areas with a larger renter population may be more transient, offering flexibility but sometimes less stability in housing markets.
It could also be an indication of market health, as affordable markets often have higher owner-occupancy rates.
The home listing price-to-income ratio in the Charlotte area is 5.1
The ratio compares how expensive homes are in Charlotte relative to household income. A higher ratio means homes cost more compared to what people earn.
A healthy price-to-income ratio is generally around 3 times your household's annual income (or less), but higher ratios can be sustainable depending on your rate, DTI, and more.
Median Home Prices by Neighborhood in the Charlotte Region
This section breaks down median home prices by neighborhood. Use these insights to see where housing costs trend higher or lower, and to better understand the market at the zip code level.
The Charlotte metro median income is $81,262.
Explore Charlotte Area Neighborhoods
See how median home prices in individual Charlotte neighborhoods compare to the overall metro median.
View this chart to learn about the median listing price and the number of active listings in Charlotte over time.
Month
Apr 2022
May 2022
Jun 2022
Jul 2022
Aug 2022
Sep 2022
Oct 2022
Nov 2022
Dec 2022
Jan 2023
Feb 2023
Mar 2023
Apr 2023
May 2023
Jun 2023
Jul 2023
Aug 2023
Sep 2023
Oct 2023
Nov 2023
Dec 2023
Jan 2024
Feb 2024
Mar 2024
Apr 2024
May 2024
Jun 2024
Jul 2024
Aug 2024
Sep 2024
Oct 2024
Nov 2024
Dec 2024
Jan 2025
Feb 2025
Mar 2025
Apr 2025
May 2025
Jun 2025
Jul 2025
Aug 2025
Sep 2025
Oct 2025
Nov 2025
Dec 2025
Jan 2026
Listing Price
$410,000
$430,000
$441,850
$429,900
$425,000
$419,950
$414,714
$401,427
$394,990
$389,950
$397,425
$400,808
$425,000
$434,881
$441,238
$439,990
$429,736
$425,000
$420,948
$414,945
$400,000
$400,000
$400,000
$410,104
$422,450
$435,000
$441,170
$439,400
$435,000
$430,000
$429,947
$428,750
$422,450
$420,000
$419,475
$425,000
$439,500
$450,000
$454,500
$449,433
$439,999
$438,500
$438,348
$429,740
$422,516
$415,000
Month
Apr 2022
May 2022
Jun 2022
Jul 2022
Aug 2022
Sep 2022
Oct 2022
Nov 2022
Dec 2022
Jan 2023
Feb 2023
Mar 2023
Apr 2023
May 2023
Jun 2023
Jul 2023
Aug 2023
Sep 2023
Oct 2023
Nov 2023
Dec 2023
Jan 2024
Feb 2024
Mar 2024
Apr 2024
May 2024
Jun 2024
Jul 2024
Aug 2024
Sep 2024
Oct 2024
Nov 2024
Dec 2024
Jan 2025
Feb 2025
Mar 2025
Apr 2025
May 2025
Jun 2025
Jul 2025
Aug 2025
Sep 2025
Oct 2025
Nov 2025
Dec 2025
Jan 2026
Active Listings
2,201
2,940
3,708
5,025
5,397
5,439
5,696
5,963
5,545
5,032
4,367
4,089
4,012
3,970
4,108
4,235
4,400
4,629
5,106
5,285
5,014
4,626
4,571
4,902
5,289
5,651
6,134
6,763
7,146
7,451
7,456
7,268
6,698
6,379
6,647
7,219
8,088
8,824
9,410
9,628
9,748
10,131
10,190
9,789
8,760
8,202
Median Days on Market
Days on Market
This chart shows the median days on market for active listings over time. In other words: how quickly homes move in the market. A declining rate means rising competition among buyers, while an increase means listings are sitting longer.
Month
Apr 2022
May 2022
Jun 2022
Jul 2022
Aug 2022
Sep 2022
Oct 2022
Nov 2022
Dec 2022
Jan 2023
Feb 2023
Mar 2023
Apr 2023
May 2023
Jun 2023
Jul 2023
Aug 2023
Sep 2023
Oct 2023
Nov 2023
Dec 2023
Jan 2024
Feb 2024
Mar 2024
Apr 2024
May 2024
Jun 2024
Jul 2024
Aug 2024
Sep 2024
Oct 2024
Nov 2024
Dec 2024
Jan 2025
Feb 2025
Mar 2025
Apr 2025
May 2025
Jun 2025
Jul 2025
Aug 2025
Sep 2025
Oct 2025
Nov 2025
Dec 2025
Jan 2026
Median Days on Market
19
21
27
31
36
43
45
48
60
70
57
43
40
39
38
39
38
40
40
43
53
59
45
38
37
32
36
37
44
48
53
55
63
67
56
43
42
44
48
53
57
58
59
62
72
78
Market Hotness Score
Market Hotness
Based on Realtor.com's Market Hotness Index, this measure reflects how competitive the housing market is by comparing buyer demand with available inventory. Rising hotness scores point to more competition, while declining scores signal cooling conditions.
Month
Apr 2022
May 2022
Jun 2022
Jul 2022
Aug 2022
Sep 2022
Oct 2022
Nov 2022
Dec 2022
Jan 2023
Feb 2023
Mar 2023
Apr 2023
May 2023
Jun 2023
Jul 2023
Aug 2023
Sep 2023
Oct 2023
Nov 2023
Dec 2023
Jan 2024
Feb 2024
Mar 2024
Apr 2024
May 2024
Jun 2024
Jul 2024
Aug 2024
Sep 2024
Oct 2024
Nov 2024
Dec 2024
Jan 2025
Feb 2025
Mar 2025
Apr 2025
May 2025
Jun 2025
Jul 2025
Aug 2025
Sep 2025
Oct 2025
Nov 2025
Dec 2025
Jan 2026
Hotness Score
76.9231
67.7258
50.5017
51.6722
56.689
55.1839
57.5251
61.3712
61.204
55.8528
59.3645
66.2207
60.0334
55.5184
56.1873
57.0234
61.5385
64.3813
69.2308
67.5585
64.7157
68.0602
69.0635
65.8863
63.3779
63.8796
57.8595
60.5351
57.0234
54.5151
50.3344
56.0201
55.6856
59.0301
58.5284
60.3679
53.3445
47.4916
46.4883
44.4816
43.6455
44.6488
44.6488
46.3211
45.3177
42.1405
Pending Homes-for-Sale %
Percentage of Homes Sold per Month
This chart shows the percentage of homes that sold each month, highlighting buyer demand and long-term market trends. In most markets, around 20% of listings selling each month is considered balanced. Higher percentages point to a strong sellers' market, while lower percentages indicate more favorable conditions for buyers.
Largest overall VA lender (purchase and refinance) for seven of the last ten years.
More VA purchase loans than any other lender for the past 10 consecutive years
Over the last six years, Veterans United made more VA purchase loans than USAA, Navy Federal Credit Union, Rocket Mortgage, Wells Fargo and Freedom Mortgage combined.
VA buyers should take advantage of South Carolina's tax-free benefit, one of the best in the Southeast. A knowledgeable support team can help navigate the VA loan process with confidence and handle any challenges that come up along the way.
Elise P.Veterans United Network Realty Agent
1-800-985-5723 | 1512 Heriford Road, Columbia, MO 65202. Not affiliated with any government agency including the VA. Missouri Licensed Real Estate Brokerage; for license information, visit VeteransUnitedRealty.com. Equal Housing Opportunity.
Start Your VA Loan With Veterans United
Not sure where to begin? Whether you're stationed nearby or planning to move near Charlotte, we’ll help you understand what to expect.
Veterans United (VU) made the purchase of our new home as easy as possible. Any delays with the purchase were with the builder, and VU kept us informed through the entire process via text, email, and phone calls. My online MVU account was a great tool.A big shout out to Toby and Zach for making ou...
Kimberly M. | Navy
Verified Customer
Amazing people they do an amazing job
James H. | Marine Corps
Verified Customer
Working with Brice at Veterans United was an absolute blessing. As a first-time homebuyer navigating this journey on my own after divorce, I was honestly nervous about the process—but Brice made everything feel manageable and even exciting. He was incredibly kind, knowledgeable, patient, and truly...
Jessica W. | Army
Verified Customer
I had one of the most interesting and difficult times with the process of buying a house. But the Veterans United Team knocked everything outta the park. They went above and beyond to make my dream come true.
Ernest S. | Army
Verified Customer
Phyllis Gatlin was extremely supportive and helpful throughout the entire process! Would absolutely recommend VU after working with her!
Zoish M. | Marine Corps
Verified Customer
stood with me during this experience outstanding
Rafael P. | Marine Corps
Verified Customer
The entire team from VU, Tyler Dunn, Jens Foreman, Vickie Bell and of course the true professional that made this whole process as painless as she could possibly make it, our real estate agent Lora Rousseau who found our perfect home for us! We owe a debt of gratitude to this amazing team of profess...
Gregory L. | Other VA Eligibility
Verified Customer
Amy, Tanner, Shawna, Noelle, and Brooke were fundamental in our success in buying our house! An amazing team with true professionals that cared about us. They were extremely responsive to ANY questions I had and explained every step in the process. So grateful we had this team. This was my second ho...
Corinn C. | Navy
Verified Customer
The whole process was so smooth! We closed in 16 days because of how smooth everything was and how on the ball everyone was. Anytime I texted or called my man Steve was right there to answer. I mean there was no time between me reaching out and Steve answering. No matter how silly or small my questi...
Campbell R. | Army
Verified Customer
Veterans United has made buying my first AND second home a breeze. Thank you!!
Sadie M. | Army
Verified Customer
So glad to work with Veterans United. You've given us our forever-home.
Jason S. | Army
Verified Customer
This was the most smooth and easy fast transaction working with Veterans United Home Loans to buy a house. Always looking out for you and checking on you to see if you need any help or updates. Even looking out for setting up insurance and services.
Steven G. | Army
Verified Customer
Craig and Kayla are absolutely amazing! From the very beginning, they worked diligently on my family’s behalf and truly went the extra mile to help us get into our first home. They did their homework by researching, advocating, and using every resource available to make sure we had the best possib...
*Unless stated otherwise, data for the metro refers to the CBSA ("Core-Based Statistical Area"), the defined geography that makes up the surrounding metropolitan and micropolitan areas.
We Use Cookies and Pixels
This website uses cookies, pixels, and similar tracking technologies to improve site functionality,
as well as for analytics and advertising.
By continuing, you agree to our use of cookies, pixels, and similar tracking technologies.
Learn more about our use of tracking technologies in our
privacy policy.
Enter to win $75,000 toward your new home!No purchase necessary; see official rules for details.
2026 New Year, New Home $75K Veteran Homebuyer Giveaway
1. realtor.com is hosting and helping to administer and promote the sweepstakes.
2. NMLS #1907 (nmlsconsumeraccess.org). Not affiliated with Dept. of Veterans Affairs or any government agency.
3. May be subject to tax withholding. See Official Rules for details.
Cookies and Related Technologies
Notice of Right to Opt-Out of Sale/Sharing
Your Privacy Choices
You can always choose to opt out of us sharing your name, email address, or other personal information with third parties for advertising purposes.
Cookies are small text files that store bits of information (such as usernames or preferences) to help recognize your device. We use cookies to keep our site running properly and to enhance your experience.
You can manage your cookie preferences at any time, including turning off advertising cookies. Please note that disabling some cookies may impact your experience on the site. Essential cookies, which are necessary for basic site functions, cannot be turned off.
These are required for the website to work correctly. They support core features like secure login and saving your progress through forms or applications.
Advertising Cookies
These cookies may share data with advertising partners in order to: